
Matcha produkten
Ett GTIN kopplar den fysiska produkten till identitet, ingredienser, näringsvärden, ursprung, certifieringar, förpackning och övrigt tillgängligt underlag.
KUNSKAPEN BAKOM BETYGET
Consupedia gör komplexa uppgifter om produkter, ingredienser och ursprung till strukturerad kunskap som människor och system kan använda. Utforska frågan, metoden, källorna och affärsnyttan bakom varje parameter.
DEN VERKLIGA SKALAN 0–100
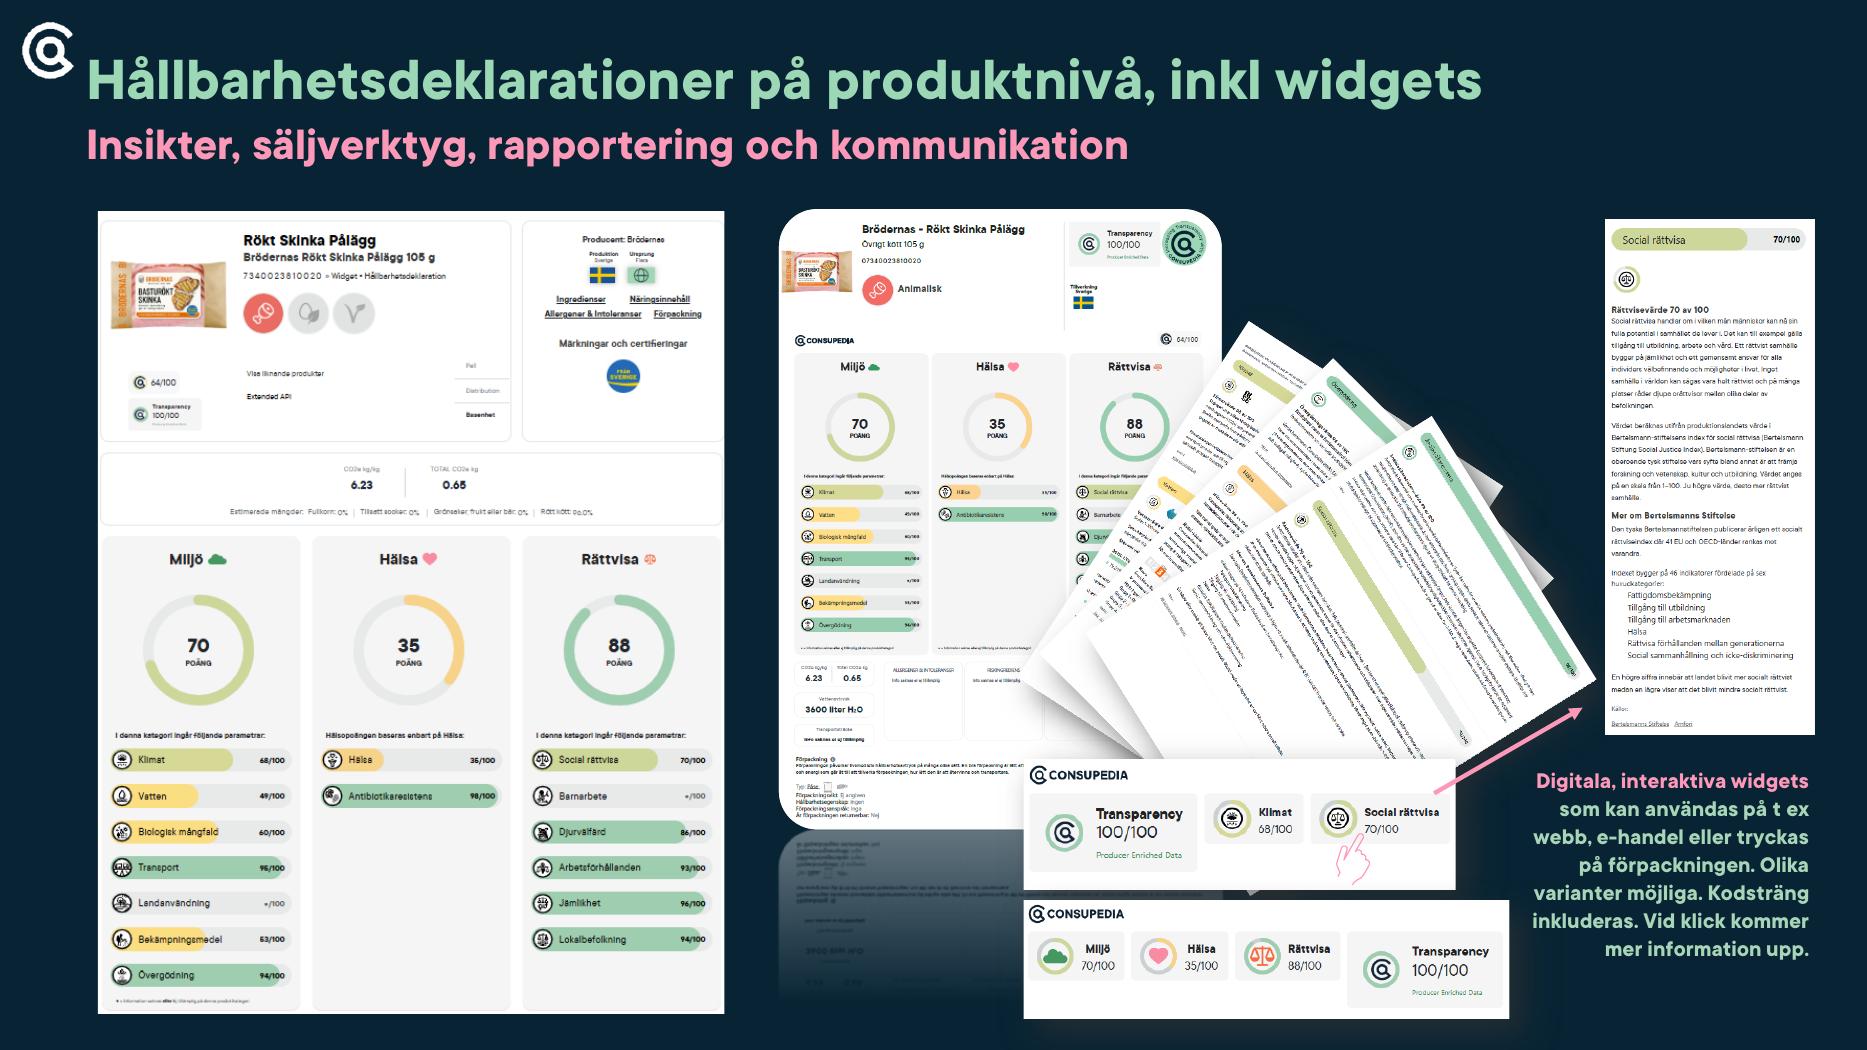
Consupedias deklarationer använder cirkelbetyg för kategorier och färgade staplar för enskilda parametrar. För jämförbara betyg är högre bättre: 0 står för den svagaste bedömda prestationen och 100 för den starkaste.
FRÅN PRODUKT TILL BESLUT
Ett GTIN kopplar den fysiska produkten till identitet, ingredienser, näringsvärden, ursprung, certifieringar, förpackning och övrigt tillgängligt underlag.
Consupedias specialiserade agenter tolkar och standardiserar ingredienslistan, mängderna och sambanden så att uppgifterna går att beräkna och jämföra.
Fakta om produkter och ingredienser matchas mot forskning, etablerade datakällor och Consupedias ämnesspecifika metoder.
Betyg, varningar, råvärden och källinformation blir tillgängliga för API:er, inköp, analys, rapportering, appar och kommunikation.
Varför en logaritmisk skala? Produkters avtryck varierar kraftigt. Consupedias forskningsbaserade skala 0–100 bevarar meningsfulla skillnader mellan produkter med både liten och stor påverkan, så att de flesta inte hamnar hoptryckta i ena änden.
Så används certifieringar. Verifierad KRAV- och ekologisk certifiering kan ge bonus i relevanta parametrar, bland annat biologisk mångfald, bekämpningsmedel, arbetsvillkor, antibiotikaresistens, djurvälfärd och övergödning. Dokumenterade produktionsval blir därmed synliga i produktvyn.
HELA PARAMETERBIBLIOTEKET
Filtrera efter område eller sök direkt. Varje kort öppnar en fördjupning med metod, källor, tolkning och praktisk affärsnytta.
Markerar ingredienser som kan utlösa allergiska reaktioner.
Uppskattar risk kopplad till antibiotikaanvändning i djurhållningen i produktionslandet.
Gör arbetsvillkor och samhällsstyrning i produktionsländer jämförbara.
Synliggör risken för barnarbete kopplad till produktionslandet.
Jämför användningen av bekämpningsmedel kopplad till produktionslandet.
Översätter potentiell artförlust till ett jämförbart produktbetyg.
Kopplar animaliska produkter till produktionslandets djurskydd.
Strukturerar material, format, klimatpåverkan och råd om avfallshantering.
Gör näringssammansättningen till ett lättbegripligt hälsobetyg från 0 till 100.
Markerar ingredienser som är relevanta för vanliga födoämnesintoleranser.
Kopplar produktionslandet till jämförbara uppgifter om ojämställdhet.
Visar det uppskattade klimatavtrycket per kilogram produkt.
Omvandlar produktens klimatavtryck till ett jämförbart betyg från 0 till 100.
Identifierar ingredienser som kan utlösa korsallergiska reaktioner.
Jämför hur mycket mark som krävs för att producera ett kilogram livsmedel.
Bedömer rättssäkerheten där ingredienser och produkter har sitt ursprung.
Klassificerar livsmedel efter bearbetningens grad och syfte.
Visar näringssammansättningen på den etablerade skalan A–E.
Jämför människors möjligheter till delaktighet och utveckling i produktionsländer.
Gör avståndet till den svenska marknaden synligt och jämförbart.
Kopplar produktens innehåll och ursprung till belastning från vattenanvändning.
Jämför risk för näringsläckage kopplad till jordbruksproduktion.
Markerar ämnen som kan innebära hälsorisker vid högt intag.
ANVÄND PRODUKTDATAN
Berätta vilka produkter, beslut och kundupplevelser ni vill förbättra. Vi visar vilka data, metoder och leveranssätt som passar.
Boka ett möte om er data